Overview: Exploring the Reports Map
The Reports Map provides a geospatial interface to explore all types of reports visually on a map.
Each report that includes a geo-location appears as a marker on the map, enabling location-based report discovery, filtering, and review. This map-based view helps analysts and collaborators quickly identify reporting activity in specific regions.
Accessing the Reports Map
The Reports Map sub-module is available in the Collaborate module.
To open the reports map view, do the following:
-
Login to the platform.
-
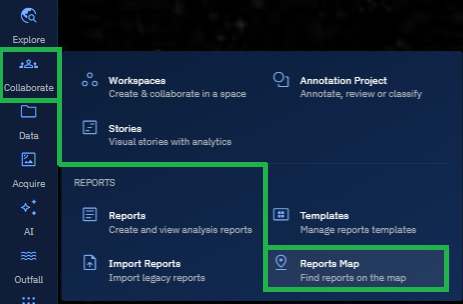
Click the Collaborate module and then select the Reports Map sub-module.
The Import Reports sub-module page is displayed. This page displays all the available geo-tagged reports displayed as markers.
Navigating the Reports Map
The map supports standard navigation features such as zooming and panning. Each marker represents one or more reports at a specific location.

Use these features to explore the spatial distribution of reports:
- Zoom in to view report density in an area.
- Pan across regions to explore different zones of interest.
- Click the markers on the map to view basic report metadata. Select the vertical three-dots or More Options menu to preview the report and view report information.